
What is a good UCAT score in 2026?
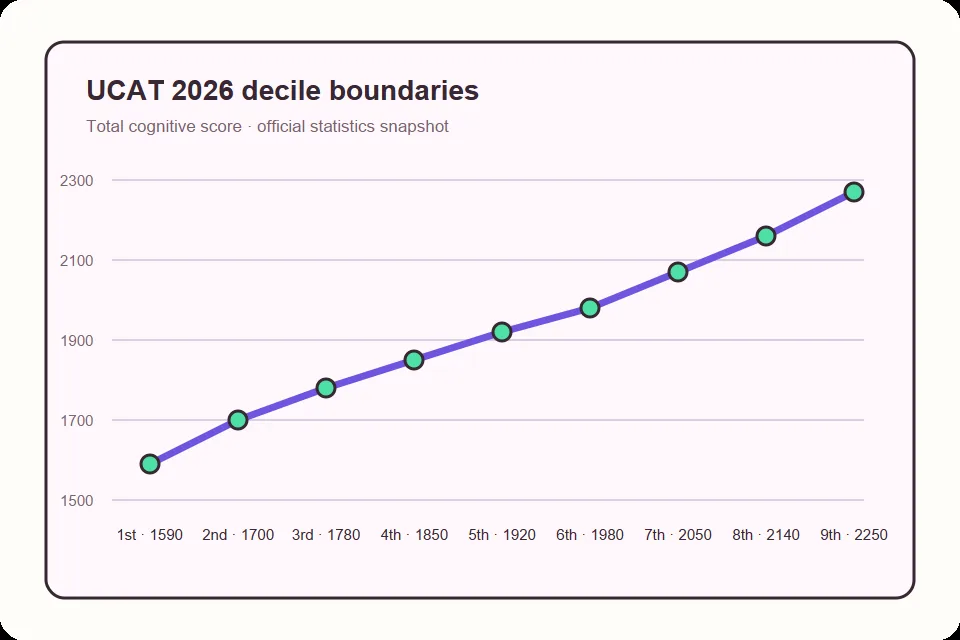
The most honest answer is: it depends on the cohort, the course and the admissions policy. The official UCAT Consortium statistics for 2026 report a mean cognitive total of 1,918 from 42,359 tests. The 5th decile boundary is 1,920, so a total around 1,920 is close to the middle of this year's distribution. A total around 2,050 reaches the 7th decile, 2,140 reaches the 8th, and 2,250 reaches the 9th.
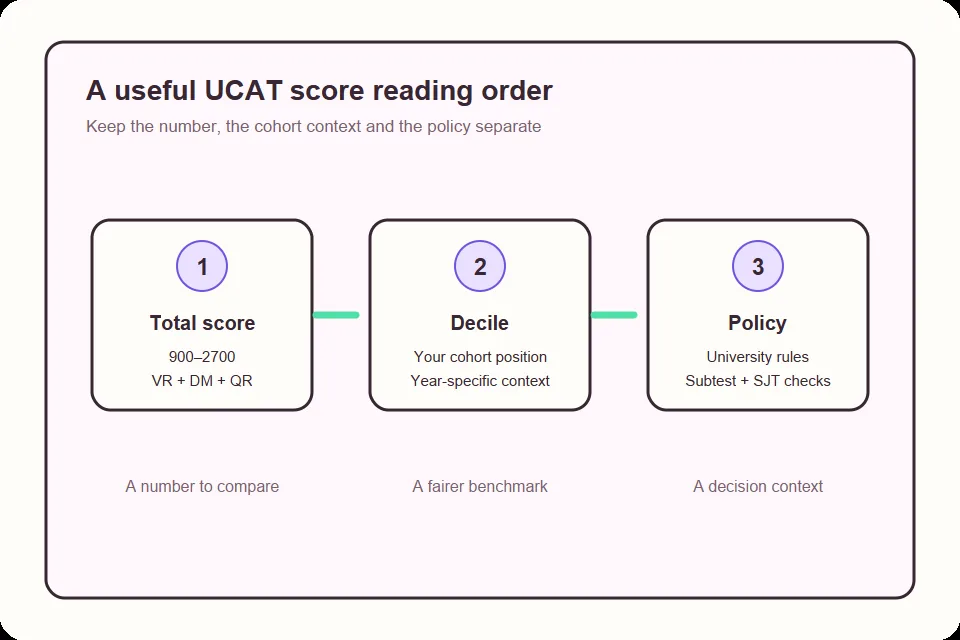
Those figures answer a ranking question: how did your result compare with other candidates in the same cycle? They do not answer the separate question of whether a particular medical school will invite you to interview. Some universities combine UCAT with academic results, some set a total threshold, and some also check individual cognitive subtests or the SJT band. Always read the current policy for the course you are considering.
Describe a score by its decile first. Saying 2,140, around the 8th decile in the 2026 table, keeps the year and comparison group visible instead of pretending that one fixed number means the same thing every year.
- Around 1,918: close to the 2026 mean cognitive total.
- Around 2,050: 7th decile reference, above roughly 70% of the cohort.
- Around 2,140: 8th decile reference, a strong top-20-percent benchmark.
- Around 2,250: 9th decile reference, a very high result in the published table.
2026 UCAT score benchmarks by decile
The table below is a compact reading aid taken from the official 2026 test-statistics page. The total column is the cognitive total out of 2,700. The VR, DM and QR columns show the corresponding subtest boundaries published for the same decile. The rows are not a conversion formula: they are reference points for understanding relative position.
A total of 2,140 sits at the 8th decile boundary, but a course may still look at a low subtest separately. SJT is reported as a band rather than added to this total.
| Decile | Total | VR | DM | QR | Reading |
|---|---|---|---|---|---|
| 1st | 1,590 | 500 | 520 | 530 | Lower 10% boundary |
| 2nd | 1,700 | 540 | 560 | 580 | Around the 20th percentile |
| 3rd | 1,780 | 560 | 590 | 600 | Around the 30th percentile |
| 4th | 1,850 | 580 | 620 | 640 | Below the mean |
| 5th | 1,920 | 600 | 640 | 670 | Middle reference |
| 6th | 1,980 | 620 | 670 | 700 | Above the mean |
| 7th | 2,050 | 640 | 690 | 730 | Strong benchmark |
| 8th | 2,140 | 670 | 710 | 780 | Top-20% reference |
| 9th | 2,250 | 710 | 760 | 820 | Top-10% reference |
Why deciles are more useful than a single cut-off
A cut-off is a decision rule set by a university or a course. A decile is a description of where candidates sit in the whole test population. Mixing those ideas creates unnecessary certainty. A score can be high in the national distribution but less useful for a course that weighs academic results heavily, while a lower score can still be workable at a university with a different selection model.
The 8th decile is 2,140 in the current table, but a future cohort could move that boundary. When a page calls a score good, ask which year, population and admissions policy it uses.
- National decile: describes your position against the test cohort.
- University cut-off: a local selection rule that can change by course and year.
- Practice target: a personal revision marker, not a prediction of an offer.
Read the total together with subtests and SJT
The UCAT cognitive total adds Verbal Reasoning, Decision Making and Quantitative Reasoning scaled scores. Each subtest uses the common 300–900 reporting range, so the total runs from 900 to 2,700. Raw marks are not directly comparable between subtests because the question counts and mark structures differ. Decision Making can award two marks for some multiple-statement questions, while Verbal Reasoning and Quantitative Reasoning use one-mark questions in the standard format.
The official 2026 mean subtest scores are 602 for Verbal Reasoning, 640 for Decision Making and 675 for Quantitative Reasoning. Use them as diagnostic context, not minimum targets. Situational Judgement is separate: Band 1 is highest, and it is not added to the cognitive total. The 2026 distribution is 15% Band 1, 40% Band 2, 34% Band 3 and 11% Band 4, with university treatment varying.
| Result part | What it tells you | What it does not tell you |
|---|---|---|
| Cognitive total | Combined VR, DM and QR scaled context | A guaranteed interview |
| Subtest scores | Where a strength or gap sits | That raw marks are interchangeable |
| SJT band | Professional-judgement performance band | A number to add to the cognitive total |
| Decile | Relative position in a cohort | A universal admissions cut-off |
Raw marks, scaled scores and calculators
Raw marks are the marks earned in a particular test form. Scaled scores place the three cognitive subtests on a shared 300–900 range. The UCAT explains that raw marks need conversion because the subtests contain different numbers of questions and different mark structures. A raw percentage can help you review accuracy, but it is not the same thing as an official scaled score.
A mock with 30 correct answers out of one denominator is not automatically equivalent to 30 out of another. The site's calculator provides an indicative study estimate and keeps its source links visible.
- Use raw marks to diagnose which subtest and question type needs practice.
- Use scaled estimates to compare cognitive subtests on the same reporting range.
- Use deciles and percentiles for cohort context, not for a guaranteed outcome.
A simple way to judge your own result
Start by writing down the exact test year and whether the number is an official score or a mock estimate. Next, record the cognitive total, the three subtest scores and the SJT band separately. Compare the total with the matching year's decile table, then open the admissions page for every university on your shortlist. Look for minimum totals, subtest rules, SJT treatment and any contextual or academic requirements.
If your result is close to a boundary, treat it as a planning range rather than over-reading a few points. Set the next revision target one step above your current reference, review the weakest subtest, and save the statistics date beside the number.
- Label the year and whether the score is official or from a mock.
- Read the total, subtests, decile and SJT as separate fields.
- Check each university's current admissions policy.
- Record the statistics date and revisit it when a new release appears.
Limits you should keep in view
No national benchmark is an admissions prediction. Universities may use different weighting, contextual data, academic requirements, subtest rules and SJT policies. The 2026 figures are a dated population snapshot, not a statement about the difficulty of an individual mock. Use the official format and statistics pages, then check each university's current admissions page.
COMMON QUESTIONS
What is a good UCAT score? FAQ
Is 2,000 a good UCAT score in 2026?
It is above the 2026 mean of 1,918 and sits between the 6th-decile boundary of 1,980 and the 5th boundary of 1,920, so it is an above-average reference rather than a universal cut-off. Check the course policy and your subtests before calling it competitive for a specific university.
Is 2,140 a good UCAT score?
In the official 2026 table, 2,140 is the 8th decile boundary, a top-20-percent reference. It is a strong national result, but it does not guarantee an interview because universities can use different totals, subtest rules, academic requirements or SJT policies.
What was the average UCAT score in 2026?
The official UCAT statistics page reports a final mean cognitive total of 1,918, based on 42,359 tests and data valid up to 24 September 2026. Means can change between cycles, so keep the date with the figure.
Does SJT count toward the UCAT total?
No. The cognitive total adds Verbal Reasoning, Decision Making and Quantitative Reasoning scaled scores and runs from 900 to 2,700. SJT is reported separately as Band 1 to Band 4.
Is a UCAT percentile the same as a raw percentage?
No. Raw percentage is the share of marks earned in a particular test form. A percentile describes your relative position against a reference cohort. The two numbers answer different questions and should not be substituted for each other.
Can I use this benchmark for UCAT ANZ?
Do not transfer the UK 2026 table to UCAT ANZ. The market, format and published statistics need their own verified context. Use the official information for the test you sat and the universities you are applying to.
CHECK THE SOURCE
Use the official context
UCAT statistics move between testing cycles. These first-party pages are the right place to check the format, scoring rules and the latest published distribution before making an application decision.
- UCAT Consortium: Test Format and ScoringSubtests, marks, scaled-score ranges and SJT bands.
- UCAT Consortium: Test Statistics 2026Mean, decile boundaries and SJT distribution checked 24 September 2026.